

Back in July 2014, I wrote an article for TPE entitled ‘Profitability Thresholds: Why ICM Isn’t Just For Final Tables’, which was well received. It attempted to come up with some guidelines for what exactly constitutes a good spot in which to pass up a preflop edge, and constructed some arguments as to why taking every +EV spot we can find is not necessarily the best play in every circumstance.
Since then, I’ve been doing some research using my own Holdem Manager 2 and PokerTracker 4 databases, and I’ve come up with a few theories that I think will supplement my original ideas and provide more weight to my conclusions. They may even end up contradicting some of my original statements, but sometimes part of being a poker coach is going through your own learning process! Let’s take a look at what I learned from my analysis.
Quantifying edges using EVbb/100
I was thinking a lot about how difficult it can be to actually quantify our edges with any degree of certainty. People like to say they have an X% ROI in a certain tournament, or that they’re “+EV against the field”, but that doesn’t give us much in the way of numbers we can use to make individual calculations. So I dug a little deeper.
I managed to pull together a database of around 1.6 million hands out of the 5 million or so I’ve played since 2009. This is a cross-section of my playing history, from hands played at the very lowest limits when I was first starting out, to hands played in the last few months.
I sorted my play by stack size, and took a look at each stack size for which I had a reliable sample of hands – this was everything from 250bb and below, so virtually the whole sample (although I was surprised to learn I’ve played at least 822 hands at more than 500bb deep!). My overall EVbb/100 over this sample was 3.96, which is a fair amount lower than what it was for 2014 overall, so I think this is a reasonably good number to represent where my game was at the beginning of my career – before I joined TPE, and when I was just starting out trying to make my way as a semi-professional and eventually a professional poker player. This is probably where many of you are now.
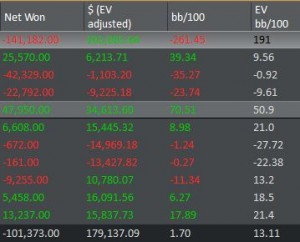
Note that I’m tracking EVbb/100 rather than just bb/100 – the amount I should have won, not the amount I actually did win, so variance is minimised. In terms of a breakdown between different stack sizes, the progression was as follows:
151-250bb: 14.81 EVbb/100
101-150bb: 7.40 EVbb/100
81-100bb: 10.70 EVbb/100
61-80bb: 4.54 EVbb/100
41-60bb: 3.96 EVbb/100
26-40bb: 2.45 EVbb/100
16-25bb: 2.16 EVbb/100
11-15bb: 0.66 EVbb/100
0-10bb: 5.43 EVbb/100 (before you question this anomaly, remember that we’re risking fewer big blinds to win the pot preflop on these stacks – it mostly just shows that people call too tight!)
These numbers are definitely pretty interesting. There’s a reasonably steady progression, although I can’t account for why I seemed to play so much better at 80-100bb than at the level above that.
How does this relate to profitability thresholds? Well, the numbers at the bottom are the important ones here. If we could estimate that my EVbb/100 at, say, 15bb were around 0.75, then this would mean that every time I turned down a play that generated 0.75bb of profit on average with a 15bb stack, it would take me one hundred hands to regain the EV I lost with that decision. This throws my original model into chaos!
Re-evaluating my original conclusions
Now, many of you will not have a sample of 1.6 million hands lying around to play around with, so you might not be aware of exactly how your numbers stack up. But the important thing here is to understand the principles at work. When we give up on a play that is slightly profitable in order to generate future profit, we give ourselves access to a new set of future opportunities, but only up to a point.
By, for example, choosing to fold a hand on the button for 15bb that we could have profitably shoved, we might give ourselves an extra six hands to find a better spot before the blinds go through us and our stack is depleted a little more. Obviously we’re paying the ante each time, but for the sake of simplicity, we won’t consider the small impact of antes on our stack.
It’s a reasonable assumption that in many cases, making a tight fold might give us an extra orbit or two in which to find a better spot. To make the calculations easier, let’s say we give ourselves an extra ten hands at the table on average by folding. If we have 15bb and our edge at that stack size is 0.75 EVbb/100, then in the ten hands of ‘breathing room’ we gain by folding, we only stand to profit by around 0.075bb. Let’s compare this to my original conclusions.
In my first article, I posited that at 10bb or below, we should take any profitable spot. I’m still comfortable with this suggestion, although the fact that it’s so easy to make more profit on shorter stacks suggests we might have more room to fold than we think if our opponents are tight. Between 10-15bb, I suggested looking for 0.5bb of profit from our plays. If we were demanding 0.5bb of profit in order to give ourselves an extra ten hands, this would suggest we thought we had a 5bb/100 edge on the table, which seems ludicrous at 10-15bb!
It’s likely, therefore, that my model was simply scaled too big. Demanding 1bb of profit at 15-20bb or 1.5bb at more than 20bb suggests I was underestimating how difficult it is to make 1bb of profit at that stack size. Any new model will have to take into account the nuances of short-stacked play and the thin edges at stake, and will most likely deal in much smaller numbers. It seems I was being kind of a nit six months ago – and not for the first time!
Constructing a new model
I have no experience in mathematical modelling, but I thought it would be useful to come up with some kind of metric by which these spots could be judged. Taking into account your own individual edge at the table when considering which spots to take and which to fold seems essential – it would make no sense for a weaker player to fold away the same edges as a high-stakes professional.
What I’ve come up with are two possibilities – the first, for lack of a better term, I’ve called the ‘edge factor’. It’s very simple – you multiply your stack size by your edge at that stack size, and divide that number by 100. The resulting number represents the amount of profit you should demand from a shove. I’m fairly happy with this as a model – it throws up appropriate results at short stack sizes, such as taking any spot that generates 0.432bb of profit if you have 20bb and a 2.16 EVbb/100 edge on that stack.
It throws up some interesting results, but I think it works quite well as a tool for approximation and retrospective evaluation. It also suggests things such as not getting pocket Kings in preflop for 150bb versus a range of {QQ+ AK+} if we have an edge of 15 EVbb/100 – this play profits by 21bb, and the model suggests we need an edge factor of 30bb to get it in. I can see how getting KK+ all-in preflop for that many big blinds isn’t always the greatest idea if you have a huge edge, so the model might be onto something. The main issue I see with this model is that it doesn’t account for how our edge increases when our stack increases – obviously taking a profitable spot is going to increase our future edge if our edge is bigger on bigger stack sizes. I’m going to try to account for this in a future model.
The second possibility is a little trickier. I’ve tried to conceptualise things in terms of dividing our edge by 100 in order to work out how many chips we profit per hand at that stack size – for example, the above case of having a 0.75 EVbb/100 edge at 15bb indicates that we make 0.0075bb/hand.
Hypothetically, there would be no point in us taking an edge that made us exactly 0.0075bb, because by folding (which is neutral EV) we would gain the opportunity to make exactly that amount on the next hand automatically. Determining how many hands of ‘breathing room’ folding gives us often depends on how long it will be before we go through the blinds again, so we can multiply the amount we make per hand by the number of hands until we hit the blinds in order to find out how much we expect to make by maintaining our normal shoving ranges before our stack takes another hit. However, there’s one key aspect that makes me prefer the first idea over this one. Let’s call it ‘The Edge Paradox’, because I’m a nerd and that sounds like it would make for a good Christopher Nolan movie.
The Edge Paradox
What I’m referring to here is the idea that the more we focus on folding profitable spots in order to preserve our edge, the more our edge decreases, because we could be making more EVbb/100 than we are if we took every single profitable spot. This creates a paradox – the more thin edges we take, the bigger our edge in the long run, which means the fewer thin edges we should take. Conversely, the lower our edge, the more thin edges we should take, and once we do that, our edge increases. I’m going to work on resolving this paradox, as well as factoring in the increase in our edge when we take profitable spots, in future models. There’s reason to suggest that simply taking every profitable spot could become a recursive model that fully maximises our edge, which would negate some of my conclusions.
Essentially, all this means is that there’s no clear answer to all of this, and there probably never will be. I’m reading some books right now which confront these issues with regard to heads-up games, and over the next few months I’m going to be working on converting what I learn from them into a format that’s more digestible for MTT players. I hope this article has given you some more food for thought, and I hope you’ll experiment with my suggestions and see whether you feel either of the models I’ve developed represent a good solution for identifying our profitability thresholds in MTTs.
jacobsharktank
I feel like there are few people into doing stupid algebra and reading into statistics as much as I do, especially out of the context of “aspiring pro” or whatever. Seriously, I encourage anyone glancing this to actually READ it and REREAD it and understand what this article is saying instead of just some casual once over. This is the work. This is where your game improves. It’s not a “how do I play AQ?” or “is this play good” The questions are way more complex than that. thanks, matt, for this article.